World Happiness AnalysisGMU
This analysis was conducted individualy for a statistical visualization course. Students could select any public data set and present on anything they found in the dataset. Because of the freedom to explore different analysis tools and tecniques, I was able to take this oppertunity to explore the use of R Shiny, an R programming app-style visualization tool, which I had always wanted to work with more. Images of the dashboard can be found at the bottom of this pages and the full project with visualizations and analysis can be found on my GitHub.
Introduction
The World Happiness Report (WHR) is a yearly report produced in partnership with the Gallup World Poll, the Oxford Wellbeing Research Center, and the UN Sustainable Development Solutions Network to review the state of country and world happiness [1]. For 17 years, data has been collected from participating countries to research individual’s feeling of well-being in their respective country and to bring attention to prioritizing happiness in policy making [1]. Each year researchers assess world happiness through new lenses including the effects of COVID-19, the differences in happiness as we age, happiness in relationship to social connections and altruism, and more. This analysis will explore the reported happiness scores for each country and the different variables associated with happiness in addition to modeling the prediction of happiness scores based on the collected attributes.
Data Description
The data used in this analysis comes from the World Happiness Report’s most recent report containing data from 2006-2023. It contains 11 attributes including country name, year, life ladder, log GDP per capita, social support, healthy life expectancy at birth, freedom to make life choices, generosity, perceptions of corruption, positive affect, and negative affect. Life ladder refers to the variable measuring “happiness” in the WHR. This column contains the national average response to the question “Please imagine a ladder, with steps numbered from 0 at the bottom to 10 at the top. The top of the ladder represents the best possible life for you and the bottom of the ladder represents the worst possible life for you. On which step of the ladder would you say you personally feel you stand at this time?”, this is also referred to as the Cantril Life Ladder [1]. Social support, freedom to make life choices, generosity, and perceptions of corruption are all national averages of binary responses to the following questions: “If you were in trouble, do you have relatives or friends you can count on to help you whenever you need them, or not?”, “Are you satisfied or dissatisfied with your freedom to choose what you do with your life?”, “Have you donated money to a charity in the past month?”, and “Is corruption widespread throughout the government/businesses or not” [1]. Positive affect represents the average response to 3 Gallup World poll questions involving laughter, feelings of enjoyment, and doing/learning something interesting [1]. Negative affect represents the average of people’s feelings of worry, sadness, and anger [1]. After obtaining the raw data from WHR the data was cleaned; this involved the removal of rows with incomplete data, cleaning column names, and joining the WHR data to world map data containing coordinates for countries (found in the maps R package).
Exploratory Data Analysis
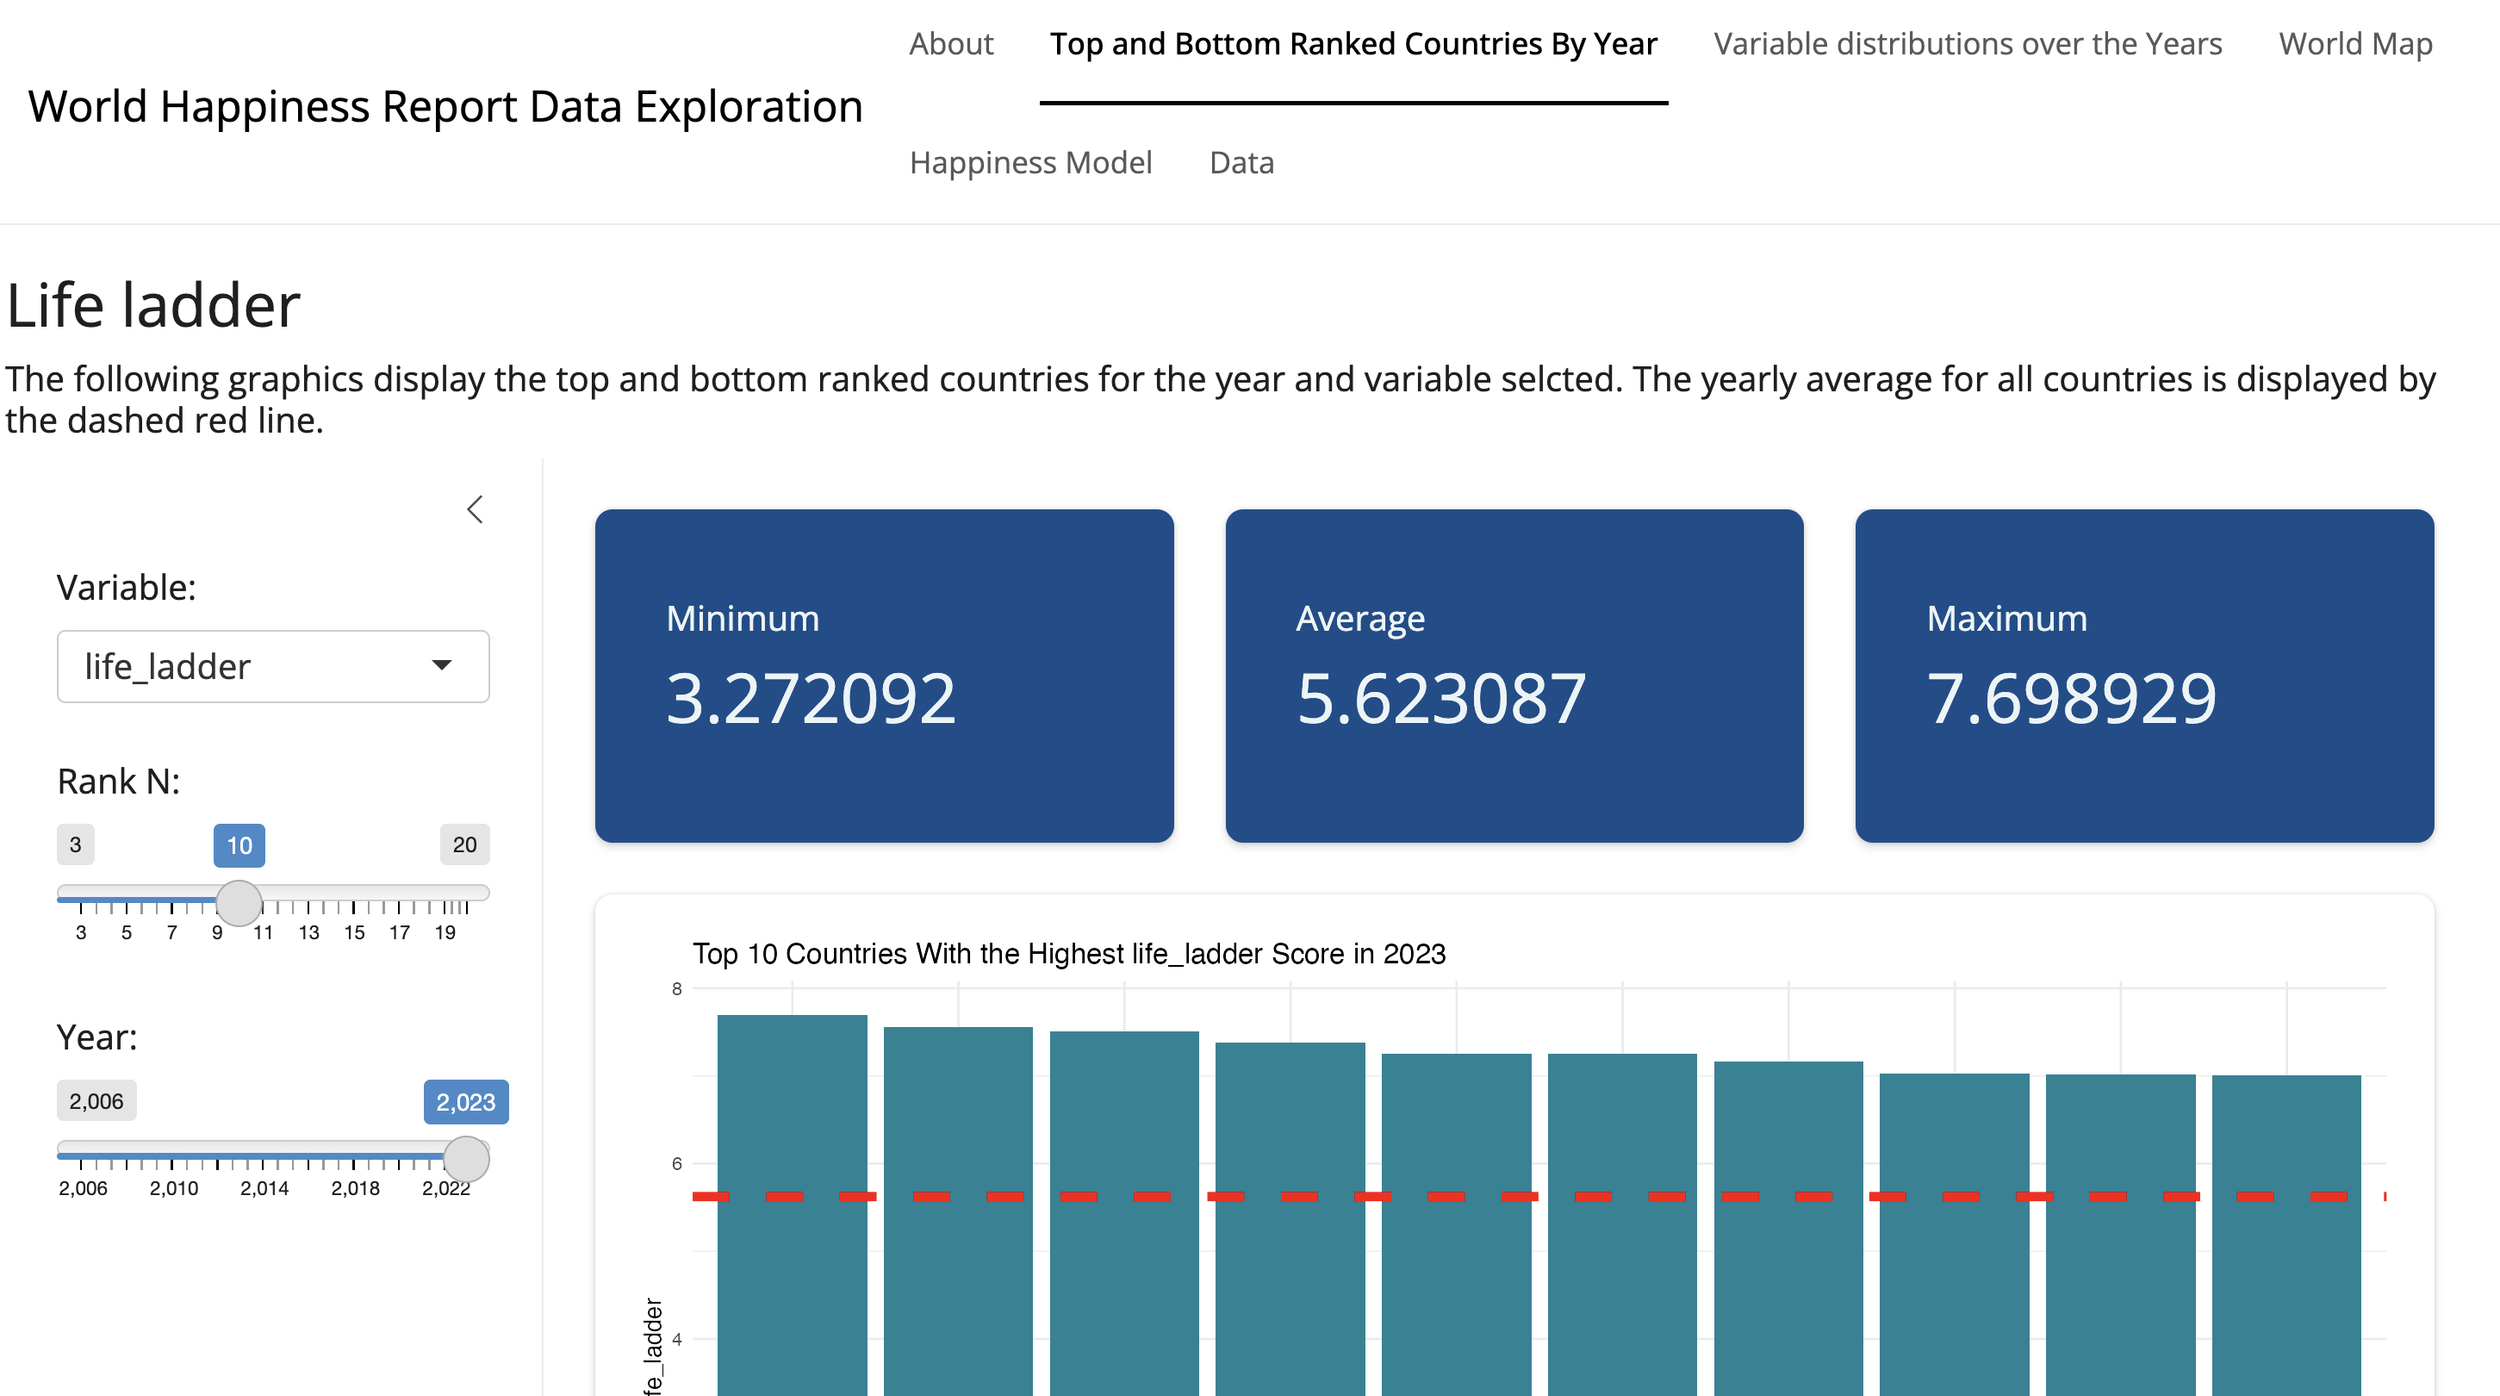
The exploratory data analysis (EDA), and graphics creations were completed using an R Shiny app. Each tab in the app displays summary statistics and data visualizations on all data attributes for all available countries. The graphics tabs include top and bottom ranked countries by year and attribute, variable distributions from 2006-2023, world map data by year, and country comparisons to the yearly average from 2006-2023. The map below shows the heat map of country happiness scores from 2023, the lighter blue the country the higher the world happiness score (grey indicating null values).
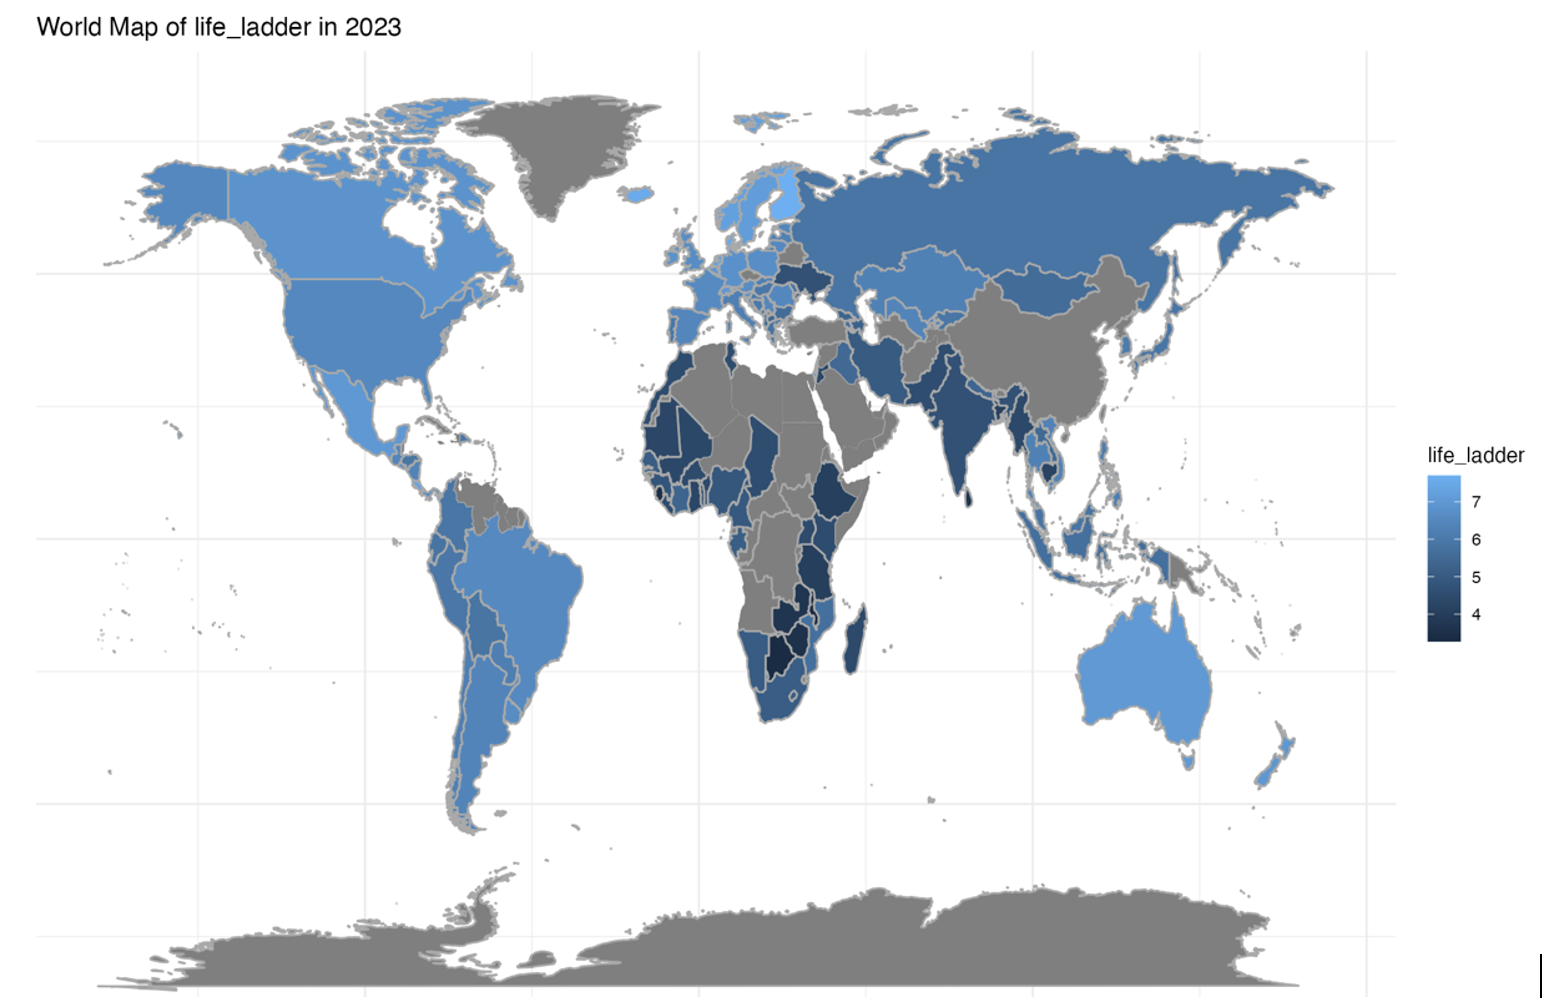
Further exploring the data visualization interface, trends in yearly data and happiness scores appear. Scandinavian countries consistently rank highly in life ladder scores over other countries.

This group of countries also score in the lowest 15 for perceptions of corruptions, and highest 15 for social support, freedom to make life choices, and log GDP. Some of these trends are also shown for countries with low life ladder scores but on the opposite scale. Using these observations from EDA, a model was created to predict happiness scores and identify significant predictors on country happiness scores.
Modeling
Using the attributes collected from the WHR, a multi-attribute linear regression model was applied to observe the influence, if any, of certain variables on the “happiness metric”, life ladder. In addition to the original data exploration using the R Shiny app, summary statistics and ggpairs plots were evaluated to aid in model creation.
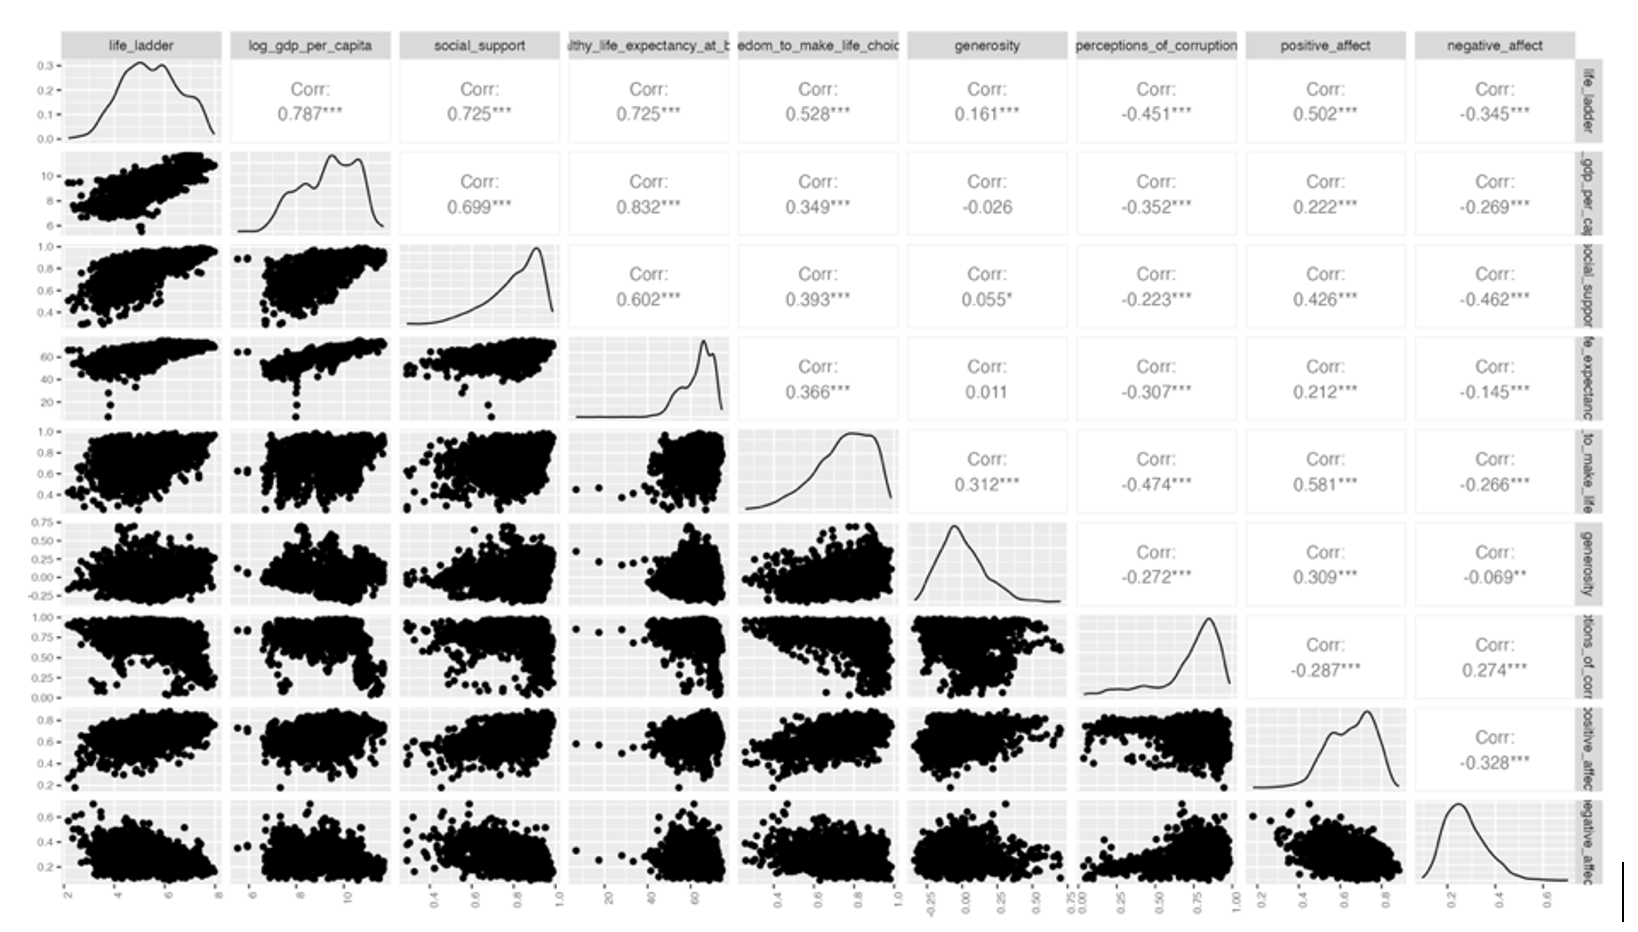
From the ggplairs plot, there appeared to be a slight positive correlation with life ladder, log GDP, social support and life expectancy at birth. The line plots on the diagonal indicated many of the variables having a strong left skew with generosity and negative affects having a right skew. The skewness was also indicated in the summary statistics of the data, shown in the R Shiny app, as the mean is higher than the median in most cases, again indicating a left skew. The skewness of the data is important as it might affect the model or suggest the transformation of variables to combat non-normality.
First, a multi linear regression using all 9 variables as the basis for the model was created in R. The base model output returned an R-squared value of 0.7784 meaning that about 77.84% of the variance in life ladder scores can be explained by the model. The “goodness” of the model can also be assessed using the standard error and f-statistic. Standard error represents the average distance a prediction falls from the modeled regression line or the average error in a model prediction. The residual standard error in the model is relatively low at 0.536. With a high F-statistic of 916.4, there was statistical significance indicating that the model was effective in explaining the dependent variable variance. Inspecting the individual variables in the model, all attributes, except negative affect, had a p-value less than 0.05. This indicates that the attribute is a significant predictor of the average national life ladder score (i.e. the coefficient is not equal to 0). Next, model assumptions including, linearity, independence, normality, and equal variance are checked.

The randomness around the 0 line in the Residuals vs. Fitted plot helps indicate linearity, independent errors, and the equal variance assumption. The Normal QQ plot indicates normality but has slight deviation from the diagonal towards the ends.
Despite the decent base model performance, improvements such as variable transformation and elimination can be made based on model evaluation. Variables with a left skew can be transformed by squaring the variables, helping with normality, and the negative affects variable, as it was not statistically significant in predicting national happiness, can be taken out of the model.
Conclusion

The figure above shows the final the linear regression model predicted vs actual values. The final model is displayed below, life ladder indicating “happiness”:

Taking out non-significant variables and transforming the data made slight improvements to our model increasing the variability in the happiness score explained by the model to 78.51%. Residual standard error decreased to 0.5277 and the f-statistic increased to 1089. All variables appear to have a significant effect on life ladder score as indicated by the coefficient p-values in the summary output. The model diagnostics in R Shiny indicate that assumptions are met for linearity, independence, and equal variance. The QQ plot appears to have improved slightly indicating better normality on the errors of the new model.
Analyzing the WHR data uncovered insights about trends and predictors in a nation’s average response to the Cantril Life Ladder. Since 2006, there has been a slight increase in the combined countries average shown in the bar plot R shiny page. On a mission to increase world happiness, leaders could focus on improving attributes of “happiness” identified as significant predictors in the linear regression model. While the model does not explain all variability in world happiness, continued data collection and research into one’s perception of happiness can further improve the model and serve the WHR mission.
References:
[1] The World Happiness Report, worldhappiness.report/